Modern applications generate an enormous amount of operational data. In many modern systems, ClickHouse® is increasingly being explored as a high-performance solution for handling this data. Every API request, database query, application event, and infrastructure component produces logs that help engineers troubleshoot failures, investigate incidents, and understand system behavior. As systems scale, storing and querying this data becomes increasingly challenging, especially with traditional log management tools that struggle with cost, performance, or scalability limitations.
This is where ClickHouse® becomes an interesting option. ClickHouse® is an open-source columnar database management system designed for analytical workloads. While it was not originally built as a dedicated log management platform, its architecture makes it well-suited for storing and analyzing large volumes of time-series event data, including application logs. However, it is important to understand what ClickHouse® is - and what it is not. It is a database for analytics, not a log collector, observability platform, or dashboarding solution, but it is often used as the core storage and query engine within larger observability stacks.
Why Traditional Log Storage Becomes Expensive
In small applications, logs are often stored in text files or relational databases. As traffic increases, this approach quickly becomes impractical.
A production system can generate millions of log entries every day. These logs typically contain fields such as:
- Timestamp
- Service name
- Log level
- Request ID
- User ID
- HTTP status
- Response time
- Error message
Engineers rarely read logs sequentially. Instead, they execute analytical queries such as:
- Show all ERROR logs from the payment service during the last hour.
- Find requests with latency greater than 500 ms.
- Count errors by service over the last 24 hours.
- Identify the most common exception messages.
These queries involve scanning large datasets while reading only a subset of columns.
Traditional row-oriented databases are optimized for transactional workloads, not analytical scans across billions of records. This mismatch often results in slower query performance and higher infrastructure costs.
Why ClickHouse® Works Well for Log Analytics
ClickHouse® was designed for Online Analytical Processing (OLAP), where large datasets are scanned and aggregated efficiently.
Several characteristics make it suitable for log analytics.
Columnar Storage
Unlike row-based databases, ClickHouse® stores data by columns.
If a query requires only the following fields:
- timestamp
- service
- log_level
ClickHouse® reads only those columns instead of every field in each log record.
This significantly reduces disk I/O and improves query performance for analytical workloads.
Compression
Logs often contain repeated values.
For example:
- Service names
- HTTP methods
- Status codes
- Log levels
Column-oriented storage enables better compression because similar values are stored together.
Lower storage consumption also reduces the amount of data that must be read during queries.
Fast Aggregations
Observability workloads frequently involve aggregation.
Examples include:
SELECT
    service,
    count(*) AS total_errors
FROM logs
WHERE log_level = 'ERROR'
  AND timestamp >= now() - INTERVAL 1 HOUR
GROUP BY service
ORDER BY total_errors DESC;
ClickHouse® is optimized for these operations and can process billions of rows efficiently on appropriately sized hardware.
Performance ultimately depends on factors such as schema design, partitioning, hardware resources, and query patterns.
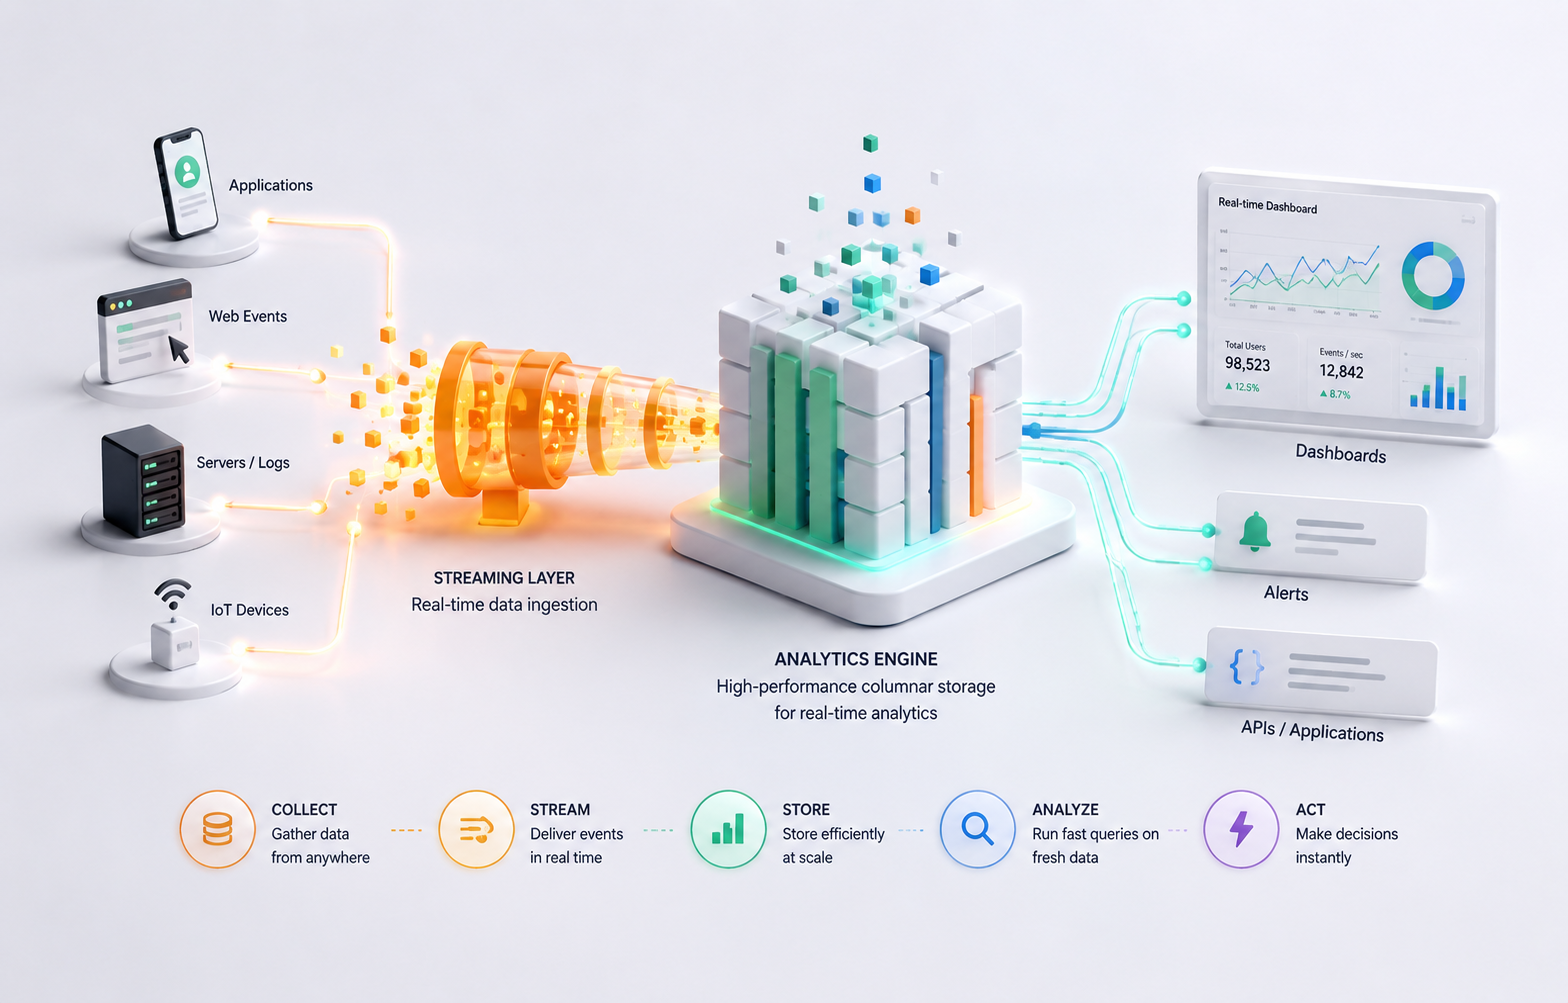
A Typical Observability Architecture
ClickHouse® usually acts as the analytics database rather than the complete observability solution.
A common architecture looks like this:
Applications
      │
      ▼
OpenTelemetry / Fluent Bit / Vector
      │
      ▼
Kafka (optional)
      │
      ▼
ClickHouse®
      │
      ▼
Grafana / Custom Dashboards
Each component has a different responsibility.
- Log collectors gather data from applications.
- Message brokers provide buffering and durability.
- ClickHouse® stores and indexes the data.
- Visualization tools present dashboards and alerts.
Separating responsibilities makes the system easier to scale and maintain.
Designing a Log Table
Logs are essentially events with timestamps.
A simplified schema might look like:
CREATE TABLE logs
(
    timestamp DateTime64(3),
    service LowCardinality(String),
    log_level LowCardinality(String),
    request_id String,
    user_id UInt64,
    endpoint String,
    status_code UInt16,
    duration_ms UInt32,
    message String
)
ENGINE = MergeTree
PARTITION BY toDate(timestamp)
ORDER BY (service, timestamp);
Some design decisions deserve attention.
LowCardinality(String)
Fields such as service names and log levels contain relatively few distinct values. Using LowCardinality reduces storage usage and can improve query performance.
Partitioning
Partitioning by date allows ClickHouse® to skip partitions outside the requested time range.
For example, a query for yesterday's logs does not need to scan partitions from previous weeks.
Primary Key (ORDER BY)
The sorting key affects how efficiently ClickHouse® can skip data during queries.
There is no universally correct ordering. It should reflect the most common query patterns.
Common Queries
Once logs are stored, engineers typically perform analyses such as:
Finding recent errors:
SELECT *
FROM logs
WHERE log_level = 'ERROR'
ORDER BY timestamp DESC
LIMIT 100;
Calculating request volume:
SELECT
    toStartOfMinute(timestamp) AS minute,
    count(*) AS requests
FROM logs
GROUP BY minute
ORDER BY minute;
Finding slow endpoints:
SELECT
    endpoint,
    avg(duration_ms) AS average_latency
FROM logs
GROUP BY endpoint
ORDER BY average_latency DESC;
These analytical queries are where ClickHouse® performs particularly well.
Performance Considerations
Using ClickHouse® effectively requires understanding its operational characteristics.
Avoid Small Inserts
Writing one log record at a time creates many small parts, increasing merge overhead and reducing efficiency.
Whenever possible, batch inserts before writing data.
Choose the Right Sorting Key
The ORDER BY clause determines how data is physically organized.
Changing it later often requires rebuilding the table, so selecting an appropriate key early is important.
Use TTL for Data Retention
Logs typically have a defined retention period.
Instead of manually deleting old records, configure TTL policies.
Example:
TTL timestamp + INTERVAL 30 DAYExpired data is automatically removed during background merges.
Monitor Merge Activity
ClickHouse® continuously merges data parts in the background.
Heavy ingestion workloads can increase merge activity and consume CPU, memory, and disk bandwidth.
Monitoring merge performance is essential in production environments.
Limitations
Although ClickHouse® is an excellent analytical database, it is not the right solution for every observability requirement.
Some limitations include:
- It does not collect logs by itself.
- It does not replace distributed tracing systems.
- It does not provide alerting or visualization.
- Full-text search capabilities differ from search engines specifically designed for document retrieval.
- Schema design has a significant impact on performance.
Organizations typically combine ClickHouse® with other tools rather than using it as a standalone observability platform.
When Should You Use ClickHouse®?
ClickHouse® is a strong candidate if your workload involves:
- High-volume log ingestion
- Time-series event data
- Interactive analytical queries
- Cost-efficient long-term log storage
- Dashboard-driven operational analytics
It may not be the best choice if your primary requirement is advanced full-text search, document indexing, or a complete observability platform without additional components.
Conclusion
ClickHouse® has become an increasingly popular database for log analytics because its columnar architecture aligns well with how engineers analyze operational data.
Instead of reading complete records, it efficiently scans only the columns required by analytical queries, enabling fast aggregations over large datasets while maintaining good storage efficiency.
However, ClickHouse® should be viewed as one component of an observability ecosystem rather than the entire solution. Production deployments typically combine it with log collectors, telemetry pipelines, and visualization tools.
When designed with appropriate schemas, partitioning strategies, ingestion pipelines, and retention policies, ClickHouse® can provide a scalable and cost-effective foundation for log analysis workloads.
Understanding both its strengths and its limitations is essential for determining whether it fits your observability architecture.