How ClickHouse® powers real-time analytics is rooted in its architecture rather than a single feature. Its column-oriented storage, vectorized query execution, and efficient data compression enable organizations to analyze continuously arriving data with low latency, making it well suited for dashboards, observability, and event analytics.
Real-time analytics has become a requirement for many modern applications. Product teams want dashboards that update within seconds, security teams need immediate visibility into suspicious events, and operations teams monitor infrastructure continuously to detect failures before they affect users.
Traditional relational databases are excellent for transactional workloads, but they are not designed to execute complex analytical queries over billions of records while new data is continuously arriving. This is where analytical databases such as ClickHouse® are designed to help.
This article explains what real-time analytics actually means, why traditional systems struggle with it, and how ClickHouse® can be used to build a real-time analytics pipeline.
What is Real-Time Analytics?
Real-time analytics is the process of collecting, processing, storing, and querying data with minimal delay after it is generated.
The exact definition of "real-time" depends on the application.
- Fraud detection systems may require responses within milliseconds.
- Infrastructure monitoring systems often accept delays of a few seconds.
- Business dashboards are commonly refreshed every few seconds or every minute.
Real-time does not always mean instantaneous. Instead, it means that the latency between data generation and analytical insight is low enough for the business use case.
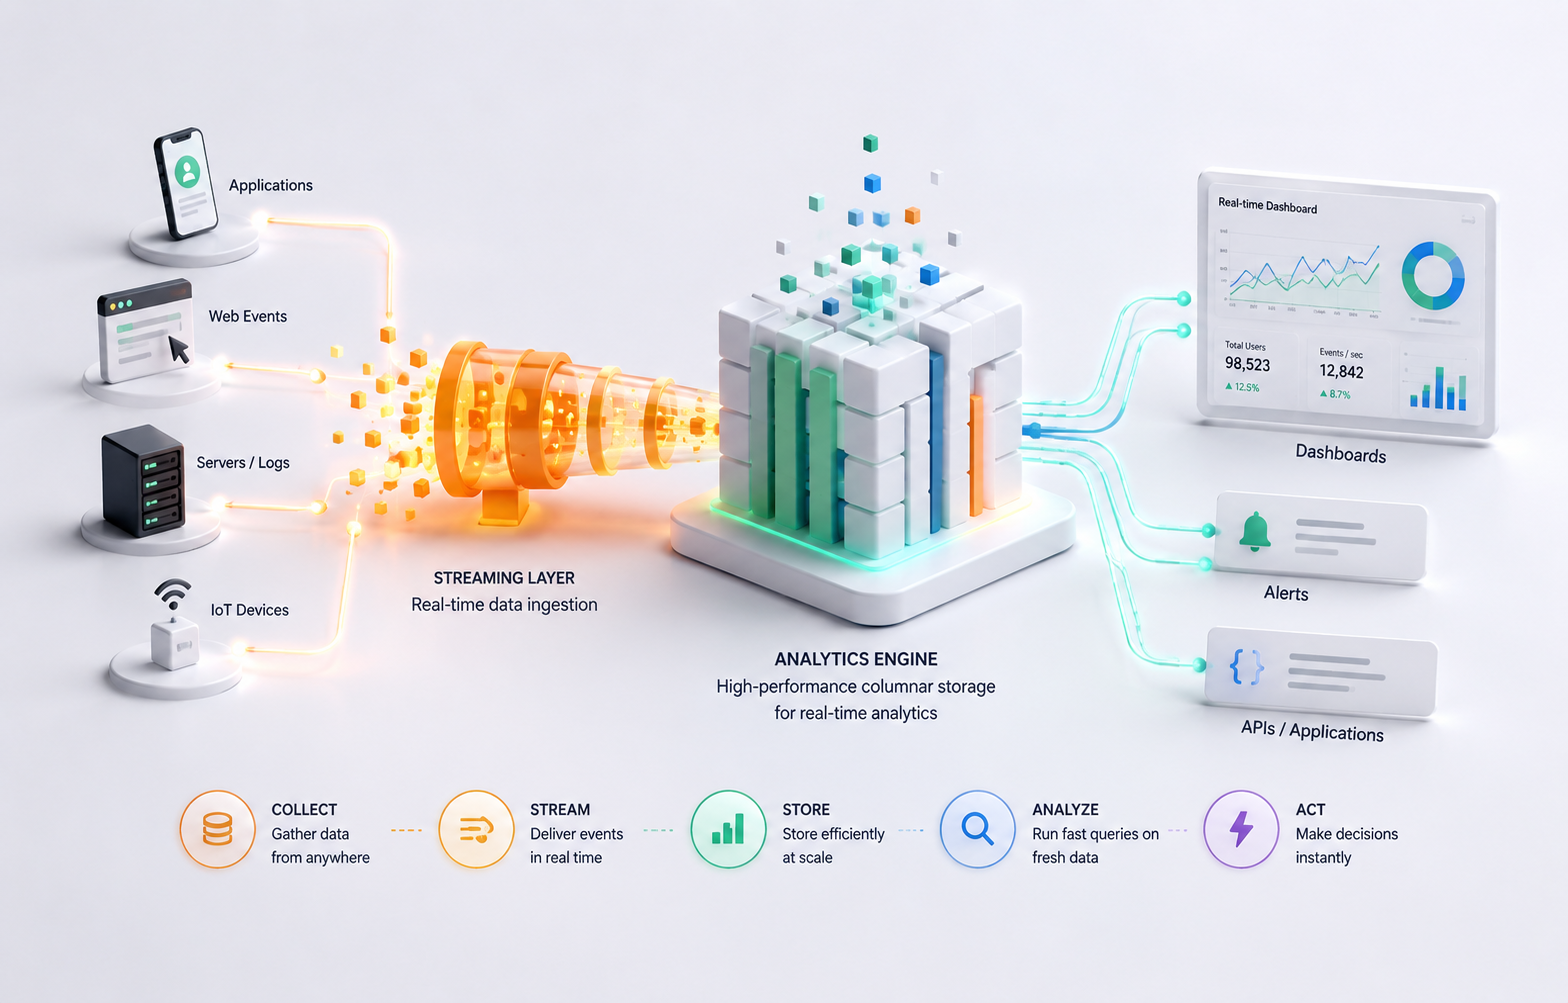
A typical real-time analytics pipeline consists of four stages:
Applications
      │
      ▼
Event Stream
(Kafka, Pulsar, etc.)
      │
      ▼
ClickHouse®
      │
      ▼
Dashboards / APIs / Alerts
Applications continuously generate events, which are streamed into ClickHouse®. Users or monitoring systems then query the latest data without waiting for scheduled ETL jobs.
Why Traditional Databases Struggle
Most relational databases are optimized for Online Transaction Processing (OLTP).
Their primary goal is to support:
- Small inserts
- Point lookups
- Frequent updates
- ACID transactions
Analytical workloads are very different.
A dashboard query might need to:
- Scan billions of rows
- Aggregate large datasets
- Filter across multiple dimensions
- Return results in seconds
Executing these workloads efficiently requires storage and execution strategies that differ significantly from OLTP databases.
For example, consider this query:
SELECT
    country,
    count(*) AS page_views
FROM page_events
WHERE timestamp >= now() - INTERVAL 1 HOUR
GROUP BY country
ORDER BY page_views DESC;
On a transactional database, this query often requires scanning a large amount of row-oriented data.
ClickHouse® stores data in a column-oriented format, allowing it to read only the columns required for the query (country and timestamp) instead of every column in the table. This significantly reduces disk I/O for analytical queries.
Why ClickHouse® Works Well for Real-Time Analytics
ClickHouse® was designed specifically for analytical workloads.
Several architectural decisions make it suitable for real-time analytics.
Column-Oriented Storage
Instead of storing complete rows together, ClickHouse® stores values column by column.
For example,
Row Storage

ID | User | Country | Device

Column Storage

ID
User
Country
Device
When a query only needs two columns out of twenty, ClickHouse® reads only those two columns.
This reduces the amount of data read from disk and improves analytical query performance.
Data Compression
Values in the same column tend to be similar.
For example,
Country

India
India
India
India
India
India
Since similar values are stored together, ClickHouse® achieves high compression ratios.
Smaller datasets require fewer disk reads, which contributes to faster query execution.
Vectorized Query Execution
Instead of processing one row at a time, ClickHouse® processes batches of values.
Modern CPUs perform many operations more efficiently on batches than on individual records.
This execution model improves CPU utilization and increases throughput for analytical queries.
Parallel Query Execution
ClickHouse® executes different parts of a query simultaneously across CPU cores.
Large aggregation queries can therefore utilize available hardware efficiently rather than processing rows sequentially.
Incremental Data Ingestion
Real-time systems continuously receive new events.
ClickHouse® supports continuous insertion of data while allowing analytical queries to run concurrently.
This makes it suitable for workloads where new events arrive every second.
It is important to note that ClickHouse® performs best when data is inserted in batches. Extremely small inserts (for example, inserting one row per request) introduce overhead and reduce ingestion efficiency. In production systems, data is commonly buffered using systems such as Kafka before being written in larger batches.
Building a Real-Time Analytics Pipeline
A common architecture looks like this:
Applications
        │
        ▼
Apache Kafka
        │
        ▼
ClickHouse®
        │
        ▼
Grafana / Superset / Custom Dashboard
Step 1: Generate Events
Applications publish events such as:
{
  "user_id": 245,
  "country": "India",
  "page": "/pricing",
  "timestamp": "2025-08-04T12:31:14Z"
}
Step 2: Stream Events
A messaging system like Apache Kafka temporarily stores the events.
Kafka acts as a durable event log that decouples data producers from consumers and helps absorb traffic spikes.
Step 3: Store Events in ClickHouse®
Events are continuously ingested into ClickHouse® tables.
A simple schema might look like this:
CREATE TABLE page_events
(
    timestamp DateTime,
    user_id UInt64,
    country String,
    page String
)
ENGINE = MergeTree
ORDER BY (timestamp, country);
The MergeTree engine is the primary storage engine in ClickHouse® and is optimized for analytical queries.
Choosing an appropriate ORDER BY key is one of the most important schema design decisions because it determines how data is physically organized on disk and influences query efficiency.
Step 4: Query Recent Data
Once data is stored, dashboards can execute queries such as:
SELECT
    toStartOfMinute(timestamp) AS minute,
    count(*) AS events
FROM page_events
WHERE timestamp >= now() - INTERVAL 30 MINUTE
GROUP BY minute
ORDER BY minute;
As new events arrive, subsequent queries automatically include them.
Performance Considerations
Fast analytics depends on more than simply choosing ClickHouse®.
Several design decisions significantly influence performance.
Batch Inserts
Larger inserts generally provide better throughput than inserting individual rows.
Whenever possible, accumulate records before writing them.
Choose an Appropriate ORDER BY Key
The primary key determines data ordering on disk.
It should reflect the most common filtering patterns used by queries.
Poor ordering can increase the amount of data scanned.
Avoid Excessive Part Creation
Each insert creates data parts that are merged in the background.
Very frequent tiny inserts create many small parts, increasing merge overhead and potentially degrading performance.
Partition Carefully
Partitioning can make data management easier, especially for retention and deletion.
However, over-partitioning creates unnecessary metadata and can negatively affect performance.
Daily or monthly partitions are often sufficient, depending on the workload.
Use Materialized Views When Appropriate
If dashboards repeatedly compute the same expensive aggregations, materialized views can precompute those results during ingestion.
This shifts computation from query time to insert time, reducing dashboard latency.
However, materialized views also consume additional storage and increase insert processing. They should be introduced only when repeated query patterns justify the trade-off.
Limitations
Although ClickHouse® is powerful for analytical workloads, it is not intended to replace every database.
It is generally not the best choice for:
- High-frequency row updates
- Heavy transactional workloads
- Applications requiring complex multi-row ACID transactions
- OLTP systems with frequent deletes and updates
A common architecture uses PostgreSQL or MySQL for transactional data while using ClickHouse® for analytical queries.
When Should You Use ClickHouse®?
ClickHouse® is a strong choice when your application needs to:
- Analyze billions of events
- Build operational dashboards
- Monitor logs or metrics
- Analyze clickstream data
- Generate business intelligence reports
- Process observability data
If your workload primarily consists of transactions, user management, or frequent record updates, a traditional relational database is usually a better fit.
Conclusion
Real-time analytics is not achieved by a database alone. It requires an end-to-end pipeline that reliably collects, transports, stores, and queries continuously arriving data.
ClickHouse® addresses the storage and query layer of that pipeline by combining column-oriented storage, efficient compression, vectorized execution, and parallel processing. These architectural choices allow it to execute analytical queries over large datasets while continuously ingesting new data.
However, performance depends on thoughtful schema design, appropriate ordering keys, efficient batch ingestion, and realistic expectations about the workload. ClickHouse® excels at analytical processing, but it is not a replacement for transactional databases.
Understanding where ClickHouse® fit-and where it does not-is the key to building reliable real-time analytics systems.