Introduction
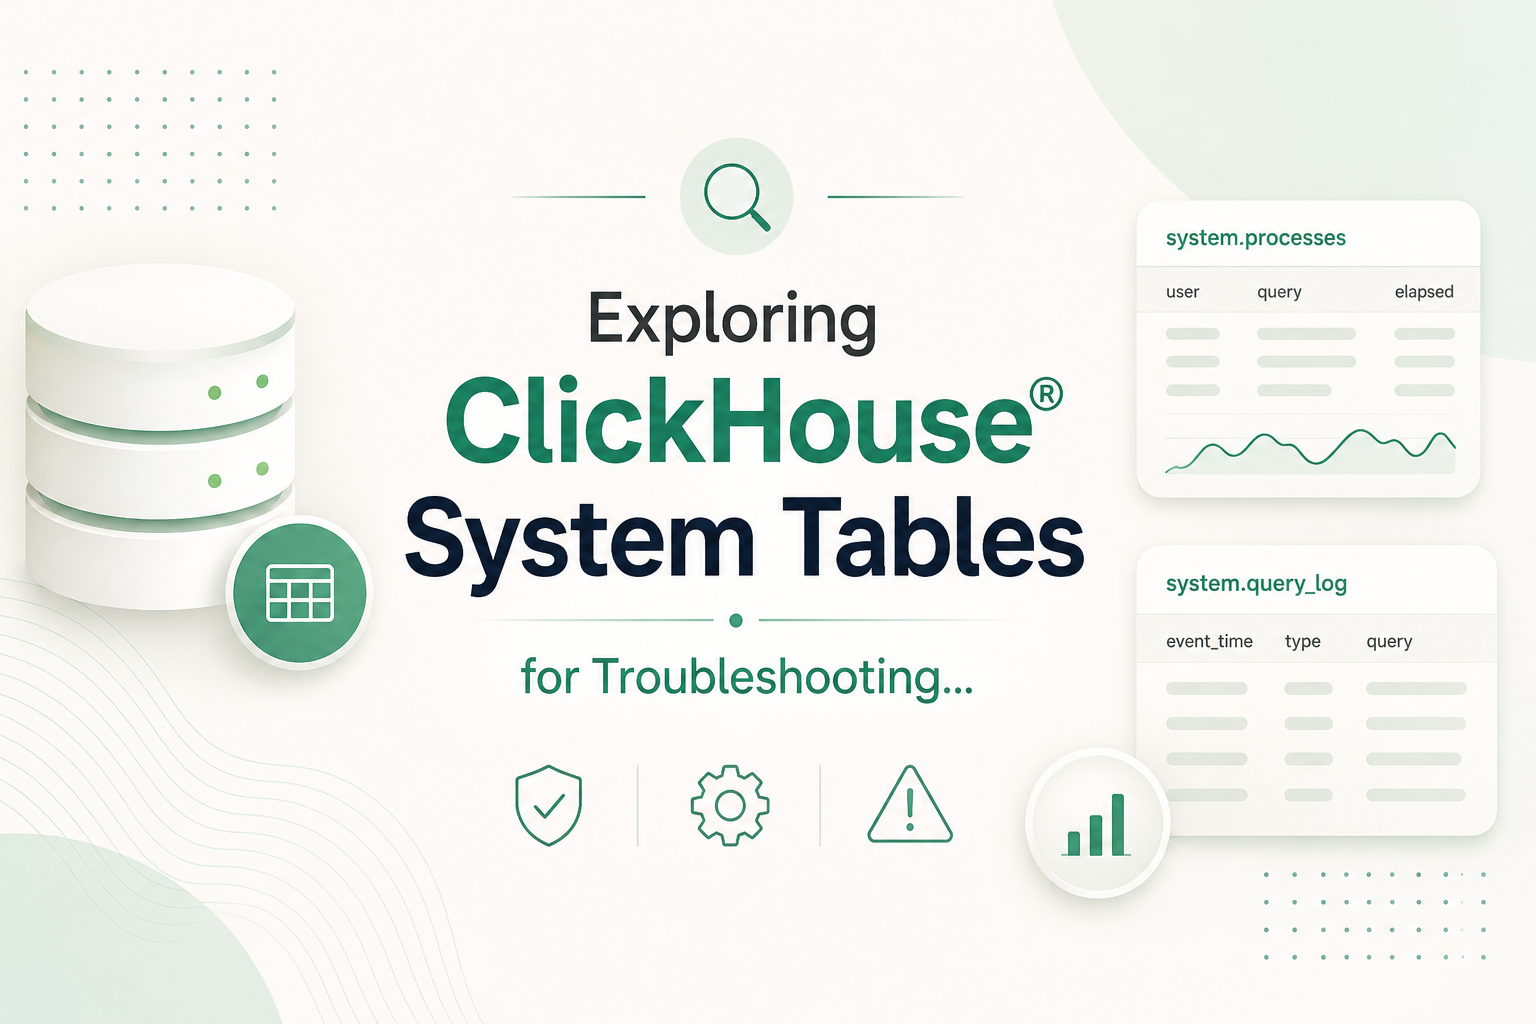
ClickHouse® provides built-in system tables that offer valuable insights into the server's internal operations. These tables help monitor queries, storage, background tasks, replication, and overall server health, making it easier to identify and troubleshoot performance issues.
In this article, we'll explore the most useful system tables and learn how to use them with practical SQL examples for effective troubleshooting.
1. What Are System Tables?
The system database is a built-in database in ClickHouse that contains read-only tables with information about the server's internal state. These tables provide metadata, runtime statistics, logs, and configuration details that help monitor performance and diagnose issues.
Common information available in system tables includes:
- Database and table metadata
- Column definitions
- Running and historical queries
- Storage parts
- Background merges and mutations
- Replication status
- Disk usage
- Server errors
Unlike user-created tables, system tables are automatically maintained by ClickHouse and can be queried using standard SQL.
2. Commonly Used System Tables
The system database contains several tables that provide insights into the internal state of a ClickHouse® server. Below are some of the most commonly used system tables for monitoring and troubleshooting.
system.tables– Contains metadata about all tables, including their database, engine, and storage information.system.columns– Displays column details such as names, data types, default values, and compression codecs.system.parts– Provides information about active data parts, including row count, size, and disk usage for MergeTree tables.system.processes– Lists all currently running queries along with execution time, memory usage, and user information.system.query_log– Stores historical query execution details, making it useful for analyzing query performance and identifying slow queries.system.errors– Records internal server errors and their occurrence counts to help diagnose recurring issues.system.merges– Shows active background merge operations and their progress.system.mutations– Tracks the status of mutation operations such asUPDATEandDELETE.system.replicas– Displays the health and status of replicated tables, including replication lag and queue information.system.disks– Shows configured storage disks along with total and available disk space.
3. When to Use System Tables?
Before diving into troubleshooting queries, it's helpful to understand when system tables are most useful. They provide real-time insights into the internal state of a ClickHouse® server and can help diagnose a wide range of operational issues.
Some common use cases include:
- Identifying slow or long-running queries
- Monitoring storage usage and data growth
- Tracking background merges and mutations
- Verifying replication health and synchronization
- Investigating server errors and resource usage
By querying the appropriate system tables, you can quickly identify the root cause of performance issues and monitor the overall health of your ClickHouse deployment.
4. Troubleshooting with System Tables
4.1 Identify Slow Queries
When users report slow query performance, system.query_log helps identify the queries with the highest execution times.
SELECT
    query,
    query_duration_ms
FROM system.query_log
ORDER BY query_duration_ms DESC
LIMIT 10;
What this query shows
- Slowest recently executed queries
- Query execution time
- Queries that may require optimization
4.2 Monitor Running Queries
If the server appears busy or unresponsive, inspect currently running queries.
SELECT
    query,
    elapsed,
    memory_usage
FROM system.processes
ORDER BY elapsed DESC;
What this query shows
- Active queries
- Execution time
- Memory consumption
4.3 Monitor Background Merges
MergeTree tables continuously merge data in the background. Monitoring merge activity helps determine whether background operations are affecting performance.
SELECT *
FROM system.merges;
4.4 Track Pending Mutations
Mutations such as UPDATE and DELETE execute asynchronously. This query lists mutations that are still in progress.
SELECT *
FROM system.mutations
WHERE is_done = 0;
4.5 Verify Replication Health
In replicated environments, monitor the replication queue and replica status.
SELECT
    database,
    table,
    queue_size,
    is_readonly
FROM system.replicas;
4.6 Monitor Disk Usage
Insufficient disk space can impact inserts and background operations.
SELECT
    name,
    free_space,
    total_space
FROM system.disks;
5. Additional Monitoring Queries
These queries provide additional insights into your ClickHouse environment.
View Largest Tables
SELECT
    database,
    table,
    formatReadableSize(sum(bytes_on_disk)) AS size
FROM system.parts
WHERE active = 1
GROUP BY database, table
ORDER BY sum(bytes_on_disk) DESC;
View Recent Query History
SELECT
    event_time,
    query,
    query_duration_ms
FROM system.query_log
ORDER BY event_time DESC
LIMIT 20;
List All Databases
SELECT *
FROM system.databases;
View Configured Storage Disks
SELECT *
FROM system.disks;
Check Server Errors
SELECT *
FROM system.errors;
View ClickHouse Version
SELECT version();Example Troubleshooting Scenario
Suppose users report that dashboards are loading slowly. A systematic approach using system tables could be:
- Check
system.processesfor long-running queries. - Review
system.query_logto identify slow queries and their execution times. - Inspect
system.mergesto determine whether background merges are consuming resources. - Verify replication status using
system.replicasif the cluster is replicated. - Confirm sufficient disk space using
system.disks.
Following this workflow helps isolate the root cause and resolve performance issues more efficiently.
6. Best Practices
To effectively troubleshoot and monitor ClickHouse:
- Monitor
system.processesto identify long-running queries. - Review
system.query_logregularly to analyze query performance. - Track
system.partsto monitor storage growth and excessive data parts. - Monitor
system.mergesandsystem.mutationsto ensure background operations complete successfully. - Check
system.replicasregularly in replicated environments to detect lag or synchronization issues. - Monitor disk usage using
system.disksto avoid storage bottlenecks. - Enable query logging in production for better visibility into historical query execution.
- Integrate system tables with monitoring dashboards and configure alerts for critical metrics.
Conclusion
ClickHouse® system tables provide a powerful way to monitor and troubleshoot your database without relying solely on external tools. By using tables such as system.processes, system.query_log, system.parts, system.mutations, and system.replicas, you can quickly identify performance bottlenecks, monitor server health, and resolve issues efficiently.
Make system tables a regular part of your monitoring strategy to improve observability, simplify troubleshooting, and maintain a reliable, high-performing ClickHouse environment.