Every database journey begins with a simple query.
If you’re new to ClickHouse®, one of the fastest open-source analytical databases available today, writing your first query is the perfect way to understand how the system works. Whether you’re exploring data analytics, observability, business intelligence, or real-time reporting, learning the fundamentals of querying ClickHouse® is an essential first step.
In this tutorial, you’ll learn how to:
- Connect to ClickHouse®
- Create a sample table
- Insert data into the table
- Run your first
SELECTquery - Filter and sort results
- Perform basic aggregations
By the end, you’ll have a solid understanding of how queries work in ClickHouse® and be ready to explore more advanced analytical workloads.
Prerequisites
Before proceeding, ensure that you have ClickHouse® installed and running.
You can verify your installation by opening a terminal and connecting to the ClickHouse® client:
clickhouse-clientIf the connection is successful, you should see a prompt similar to:
Connected to ClickHouse server version xx.xx.x.

:)
Now you’re ready to start querying data.
Step 1: Create a Database
Although ClickHouse® ships with a default database, creating a dedicated database for experimentation is a good practice.
Run the following command:
CREATE DATABASE tutorial;Switch to the newly created database:
USE tutorial;Output:
Ok.

0 rows in set.
You are now working inside the tutorial database.
Step 2: Create Your First Table
Let’s create a simple table that stores website visit information.
CREATE TABLE website_visits
(
    user_id UInt32,
    page String,
    visit_time DateTime
)
ENGINE = MergeTree
ORDER BY visit_time;
Understanding the Table Definition
Let’s break down the statement:
| Component | Description |
|---|---|
user_id | Unique identifier for a user |
page | Page visited by the user |
visit_time | Timestamp of the visit |
MergeTree | The most commonly used table engine in ClickHouse® |
ORDER BY visit_time | Defines the primary sorting key for efficient querying |
Unlike traditional databases, ClickHouse® requires an ORDER BY clause when creating a MergeTree table. This sorting key plays a critical role in query performance.
Step 3: Insert Sample Data
Now let’s add some records.
INSERT INTO website_visits VALUES
(1, '/home', '2025-08-01 10:00:00'),
(2, '/products', '2025-08-01 10:05:00'),
(1, '/pricing', '2025-08-01 10:10:00'),
(3, '/home', '2025-08-01 10:15:00');
Output:
Ok.

4 rows in set.
The table now contains four records.
Step 4: Run Your First Query
The simplest query in ClickHouse® is a SELECT statement.
SELECT *
FROM website_visits;
Example output:
┌─user_id─┬─page───────┬──────────visit_time─┐
│       1 │ /home      │ 2025-08-01 10:00:00│
│       2 │ /products  │ 2025-08-01 10:05:00│
│       1 │ /pricing   │ 2025-08-01 10:10:00│
│       3 │ /home      │ 2025-08-01 10:15:00│
└─────────┴────────────┴─────────────────────┘
This query retrieves all rows and columns from the table.
While useful for exploration, production workloads typically select only the required columns.
For example:
SELECT user_id, page
FROM website_visits;
Step 5: Filter Data with WHERE
Filtering is one of the most common operations in analytics.
Suppose you want to see only visits made by user 1.
SELECT *
FROM website_visits
WHERE user_id = 1;
Output:
┌─user_id─┬─page──────┬──────────visit_time─┐
│       1 │ /home     │ 2025-08-01 10:00:00│
│       1 │ /pricing  │ 2025-08-01 10:10:00│
└─────────┴───────────┴─────────────────────┘
The WHERE clause allows ClickHouse® to filter rows before returning results, reducing the amount of data processed and transferred.
Step 6: Sort Results
You can order results using the ORDER BY clause.
For example:
SELECT *
FROM website_visits
ORDER BY visit_time DESC;
Output:
┌─user_id─┬─page───────┬──────────visit_time─┐
│       3 │ /home      │ 2025-08-01 10:15:00│
│       1 │ /pricing   │ 2025-08-01 10:10:00│
│       2 │ /products  │ 2025-08-01 10:05:00│
│       1 │ /home      │ 2025-08-01 10:00:00│
└─────────┴────────────┴─────────────────────┘
The DESC keyword sorts results in descending order.
To sort in ascending order, use:
ORDER BY visit_time ASCor simply:
ORDER BY visit_timeStep 7: Count Rows
Aggregation is where ClickHouse® truly shines.
To count the number of rows:
SELECT count()
FROM website_visits;
Output:
┌─count()─┐
│        4│
└─────────┘
The count() function is optimized in ClickHouse® and is frequently used in analytical workloads.
Step 8: Group Data
Grouping allows you to summarize large datasets.
Let’s count visits per page:
SELECT
    page,
    count() AS visits
FROM website_visits
GROUP BY page;
Output:
┌─page───────┬─visits─┐
│ /home      │      2 │
│ /products  │      1 │
│ /pricing   │      1 │
└────────────┴────────┘
This query answers a common analytics question:
Which pages receive the most traffic?
As datasets grow from thousands to billions of rows, ClickHouse® remains highly efficient at performing these aggregations.
Step 9: Add a LIMIT Clause
Large analytical tables can contain millions or even billions of rows.
To preview a subset of data:
SELECT *
FROM website_visits
LIMIT 2;
Output:
┌─user_id─┬─page──────┬──────────visit_time─┐
│       1 │ /home     │ 2025-08-01 10:00:00│
│       2 │ /products │ 2025-08-01 10:05:00│
└─────────┴───────────┴─────────────────────┘
Using LIMIT is a common practice during data exploration.
Common Query Pattern
As you work with ClickHouse®, you’ll frequently combine filtering, grouping, sorting, and limiting in a single query.
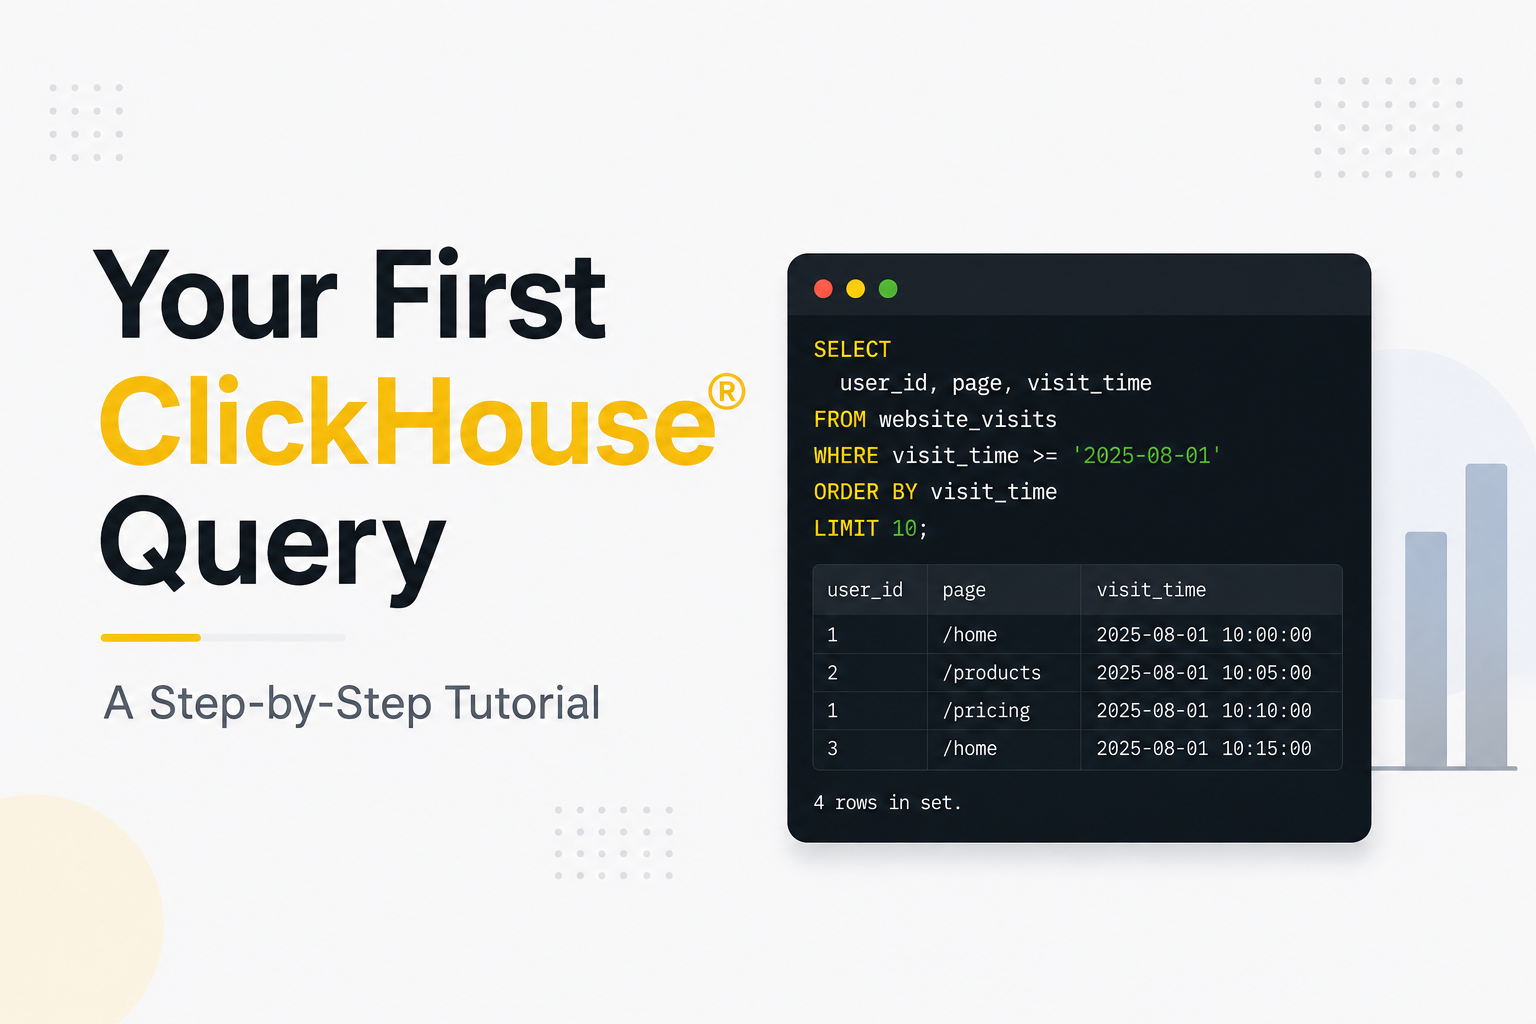
Example:
SELECT
    page,
    count() AS visits
FROM website_visits
WHERE visit_time >= '2025-08-01 00:00:00'
GROUP BY page
ORDER BY visits DESC
LIMIT 10;
This pattern forms the foundation of many dashboards, reports, and monitoring systems.
What Makes Querying ClickHouse® Different?
Although the SQL syntax feels familiar, ClickHouse® is designed for analytical workloads rather than transactional processing.
Key characteristics include:
- Column-oriented storage
- High-speed aggregations
- Efficient compression
- Parallel query execution
- Real-time analytical capabilities
These design choices enable ClickHouse® to process massive datasets with low latency, making it a popular choice for observability platforms, analytics products, and data-intensive applications.
Exploring ClickHouse® for Your Analytics?
At Quantrail Data, we help teams run ClickHouse® reliably for real-time analytics – from Kubernetes deployments and migrations to performance tuning in production.
We see these challenges firsthand while supporting demanding analytics workloads. In one recent engagement, a customer achieved near bare-metal performance with ClickHouse® in production – a story we’ve shared here:
Success Story: Quantrail Bare-Metal ClickHouse® Deployment
If you’re evaluating ClickHouse® or trying to get more out of an existing setup, we’re happy to share practical lessons from real-world deployments.
Contact
Quantrail Data
Conclusion
Your first ClickHouse® query is more than just a SELECT statement – it’s the beginning of understanding how modern analytical databases operate.
In this tutorial, you learned how to:
- Create a database
- Create a table
- Insert data
- Retrieve records
- Filter results
- Sort data
- Count rows
- Perform aggregations
These fundamentals form the building blocks of virtually every analytical workflow in ClickHouse®.
Once you’re comfortable with these basics, the next topics to explore include materialized views, partitions, joins, window functions, projections, and query optimization techniques.
The best way to learn ClickHouse® is by querying real data. Start with small datasets, experiment with different SQL statements, and gradually move toward larger analytical workloads.
References
Official ClickHouse® Documentation – https://clickhouse.com/docs
Suggested Articles
What is ClickHouse®? A Beginner’s Guide to the OLAP Database
Getting Started with ClickHouse®: OSS – Installation and Setup
ClickHouse vs PostgreSQL: When to Use Which?
Understanding Column-Oriented Databases: The ClickHouse Advantage