1. Introduction
Modern data platforms require continuous monitoring to maintain data quality and system stability. In large-scale environments, duplicate records or incomplete processing can silently affect analytics and reporting accuracy. To address this problem, I designed a self-healing monitoring pipeline using ClickHouse, Airflow, and Grafana. This architecture transitions from manual oversight to an automated remediation model. The system independently detects anomalies, executes corrective cleanup logic, and logs granular execution metrics.
By integrating automation with observability, the pipeline improves data reliability. It also reduces manual intervention in production environments.
2. Why This System Was Needed
Data ingestion pipelines commonly face issues such as duplicate entries caused by retries, batch reprocessing, or unexpected system interruptions. If these issues are not detected promptly, they can affect reporting accuracy, increase storage usage, and reduce system trustworthiness.
Traditional monitoring relies on manual checks or delayed reviews. Therefore, issues can remain unnoticed for extended periods.
To improve reliability, the system was designed to:
- Detect duplicate records in near real time
- Execute corrective cleanup automatically
- Record monitoring metrics for analysis
- Provide visual dashboards
- Trigger alerts when thresholds are exceeded
The objective was clear: combine detection with automated correction.
3. How the System Works
The monitoring pipeline operates on a scheduled interval using Airflow. At regular intervals, a monitoring script connects to ClickHouse and evaluates the target table for duplicate records.
When the script detects duplicates, it executes cleanup queries and triggers table optimization to apply deletions immediately. The system then records execution results and metrics in a logging table.
Grafana reads these metrics to visualize system health and data quality trends. Alert rules continuously evaluate the latest metrics, and the system triggers notifications when it detects abnormal conditions.
This workflow establishes an automated cycle of monitoring, correction, logging, and alerting, enabling a self-healing data reliability process.
4. Technical Architecture Overview
Pipeline Flow
The monitoring system operates as an automated workflow that validates data, performs cleanup, logs results, and triggers alerts.
System Architecture Diagram
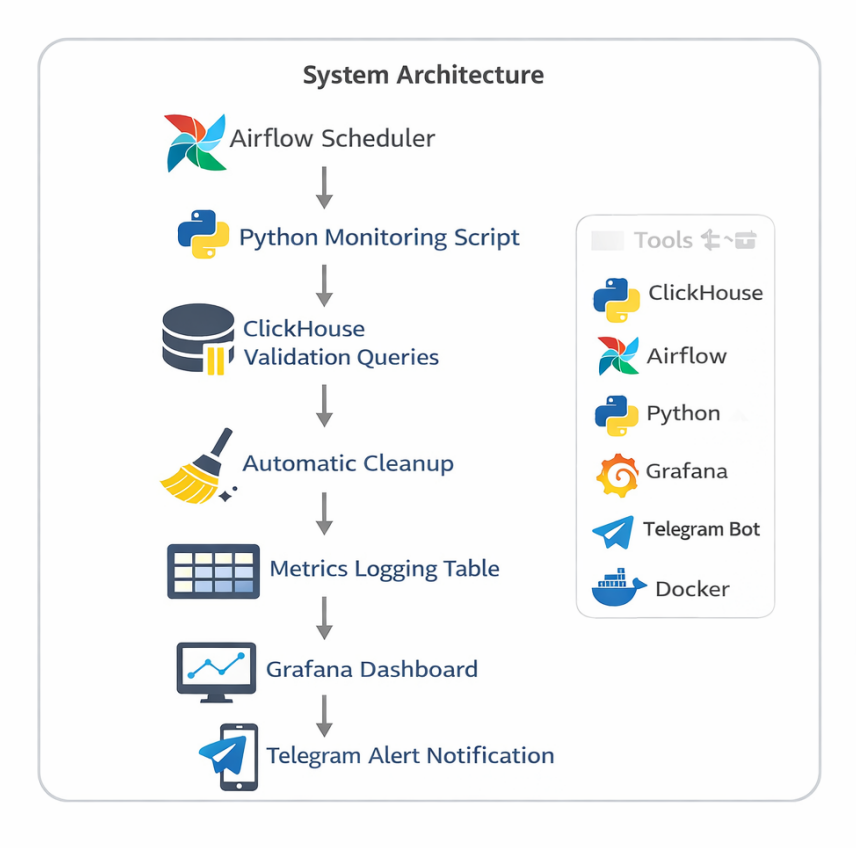
System Architecture of the Monitoring Pipeline
Workflow
- Airflow Scheduler triggers the monitoring job at regular intervals.
- The Python script connects to ClickHouse and checks for duplicate records.
- If the script detects duplicates, it executes cleanup queries.
- The script stores results in the metrics logging table.
- Grafana reads metrics for visualization.
- Alert rules evaluate the latest values and send Telegram notifications when thresholds are exceeded.
This workflow enables continuous monitoring and automated remediation.
Technology Stack
| Component | Technology | Role |
|---|---|---|
| Scheduler | Airflow | Triggers monitoring jobs |
| Processing | Python Script | Performs validation and cleanup |
| Database | ClickHouse | Stores data and metrics |
| Visualization | Grafana | Displays monitoring dashboards |
| Alerting | Telegram Webhook | Sends notifications |
| Deployment | Docker | Containerized environment |
5. Implementation Workflow
Step 1. Creating Monitoring Tables
I created two tables to separate operational data from monitoring metrics..
- Events Table: Stores incoming records that require validation.
- Metrics Log Table: Stores monitoring results for each execution cycle, including:
check_time,table_name,duplicate_count,detached_parts,status, anddeleted_rows.
Step 2. Detecting Duplicates
The system identifies duplicate records using an aggregation query.
SELECT count() FROM (
    SELECT id FROM events GROUP BY id HAVING count() > 1);
This query detects identifiers that appear more than once in the dataset.
Step 3. Self-Healing Cleanup Mechanism
When duplicates are detected, the script executes automated cleanup logic:
- Delete duplicate records
- Force table optimization
- Record number of rows removed
OPTIMIZE TABLE events FINAL;This step is required because deletions in ClickHouse are asynchronous. Table optimization ensures that cleanup is applied immediately.

Cleanup Execution Output Showing Duplicate Detection and Removal
Step 4. Logging Monitoring Metrics
Each monitoring run stores execution results in the metrics_log table. This table records duplicate counts, cleanup activity, system status, and timestamps for every cycle.
This structured logging enables historical tracking, easier debugging, and real-time observability without manually checking logs.
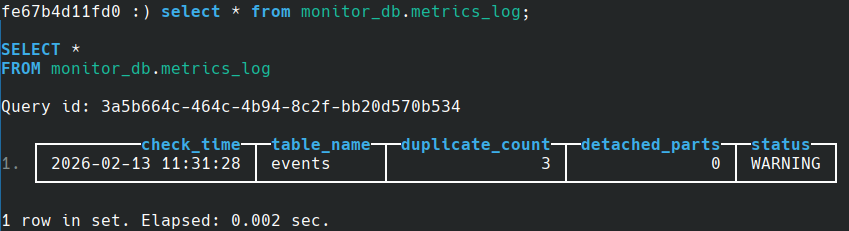
Monitoring Metrics Stored in metrics_log Table
Step 5. Automation with Airflow
The monitoring workflow is automated using an Airflow DAG. The system consists of two components:
- DAG definition file: controls scheduling and execution
- Monitoring script: performs duplicate detection and remediation logic
monitor.py
Python

from clickhouse_driver import Client
from datetime import datetime

# connection
client = Client(
   host="ch_monitor",
   port=9000,
   user="default",
   password="gayathri",
   database="monitor_db")

# duplicate check
duplicate_query = """
SELECT count()
FROM (
   SELECT id
   FROM events
   GROUP BY id
   HAVING count() > 1
)
"""
duplicate_count = client.execute(duplicate_query)[0][0]
original_duplicates = duplicate_count
deleted_rows = 0

# self-healing: delete duplicates if found
if duplicate_count > 0:
   print("Duplicates detected starting cleanup")
   before_count = client.execute("SELECT count() FROM events")[0][0]
   delete_query = """
   ALTER TABLE events DELETE WHERE id IN (
       SELECT id
       FROM events
       GROUP BY id
       HAVING count() > 1
   )
   """
   client.execute(delete_query)
   client.execute("OPTIMIZE TABLE events FINAL")
   after_count = client.execute("SELECT count() FROM events")[0][0]
   deleted_rows = before_count - after_count
   print("Duplicate rows removed:", deleted_rows)

# detached parts check
detached_query = "SELECT count() FROM system.detached_parts"
detached_count = client.execute(detached_query)[0][0]

# status logic
status = "OK"
if duplicate_count > 0:
   status = "CLEANED"
elif detached_count > 0:
   status = "WARNING"

# insert metrics
insert_query = """
INSERT INTO metrics_log
(check_time, table_name, duplicate_count, detached_parts, status, deleted_rows)
VALUES
"""
client.execute(insert_query, [(
       datetime.now(),
       "events",
       original_duplicates,
       detached_count,
       status,
       deleted_rows if duplicate_count > 0 else 0
   ) ])
monitor_dag.py
Python

from airflow import DAG
from airflow.operators.bash import BashOperator
from datetime import datetime

with DAG(
    dag_id="clickhouse_monitor",
    start_date=datetime(2024,1,1),
    schedule_interval="*/10 * * * *",
    catchup=False
) as dag:
    run_script = BashOperator(
        task_id="run_monitor_script",
        bash_command="python /opt/airflow/dags/monitor.py"
    )
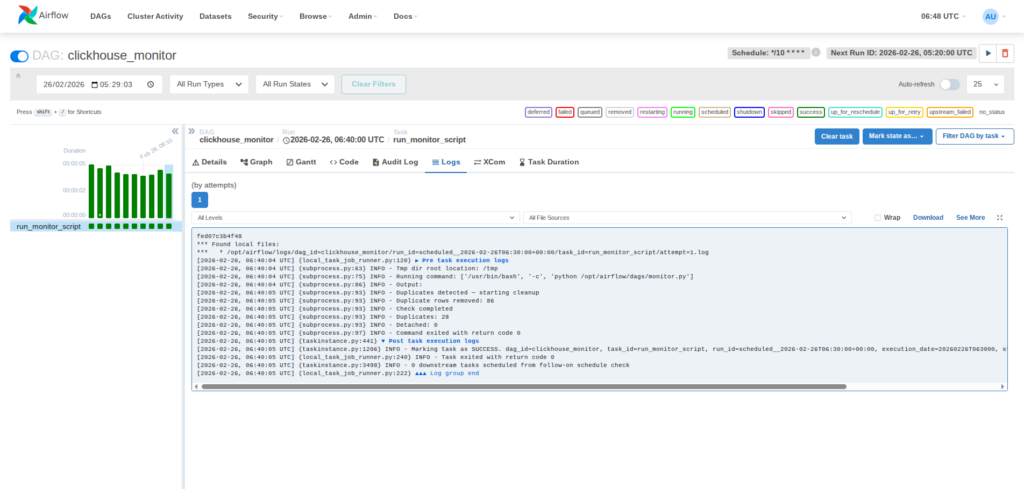
Airflow DAG execution success view
This automation ensures that monitoring tasks run consistently, detect issues promptly, and apply corrective actions without manual intervention.
Step 6. Visualization Using Grafana
Grafana connects to ClickHouse using the official data source plugin. I configured the connection using the database host, port, credentials, and target database.
After the connection is established, I created a time-series dashboard using the metrics_log table. The query retrieves duplicate counts based on execution timestamps, allowing trends to be visualized over time.
This dashboard enables:
- Duplicate tracking – Identifies when data issues occur
- Cleanup monitoring – Verifies the effectiveness of remediation
- Trend analysis – Detects recurring pipeline anomalies
- Real-time observability – Provides instant visibility into system health
This integration converts raw monitoring metrics into structured visual dashboards, allowing faster diagnosis and simplified operational analysis.
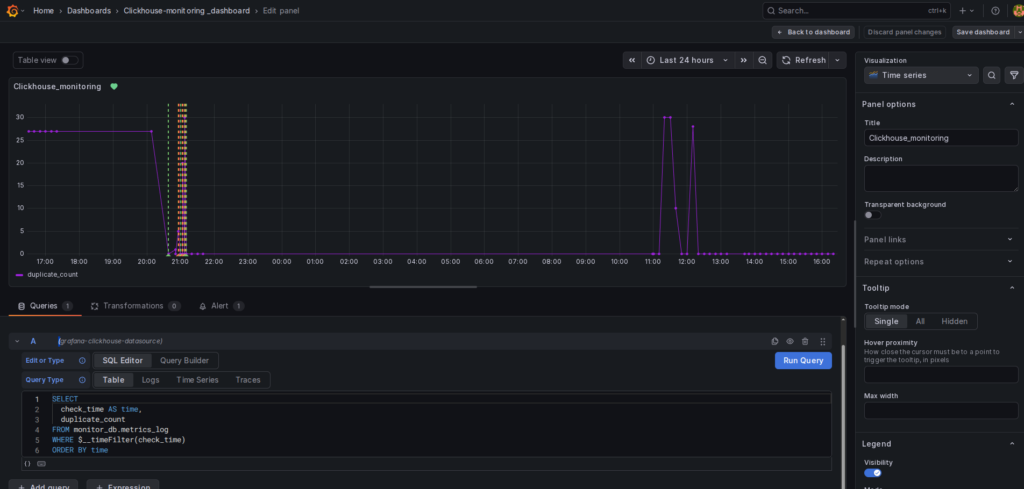
Grafana dashboard showing duplicate metrics graph
Step 7. Real-Time Alerting with Telegram
I configured an alert rule in Grafana to monitor duplicate counts from the metrics table. When the value exceeds the defined threshold, Grafana sends a notification automatically through a Telegram webhook.
Creating the Telegram Bot To enable these notifications, I used Telegram’s BotFather to create a dedicated alert bot. The process included:
- Initiating a chat with @BotFather on Telegram.
- Using the
/newbotcommand and following the prompts to set a display name and a unique username. - Receiving the API Token, which acts as the authentication key for Grafana.
- Starting a conversation with the new bot to enable message delivery.
Alert Rule Configuration : The configuration defines the query and the specific conditions used to trigger alerts. For this pipeline, any duplicate_count > 0 for a sustained period of 5 minutes triggers an incident.
Alert State History : Grafana maintains a detailed log of alert transitions. This view displays states such as Pending (condition met but duration not reached), Alerting (notification dispatched), and Normal (issue resolved by the self-healing script).
Telegram Alert Notification : When a monitoring threshold is breached, The system delivers a real-time message directly to the Telegram chat. This message contains critical details about the table name and the severity of the duplication, ensuring immediate awareness.
This alerting setup ensures immediate detection and notification of data quality issues, allowing for full transparency even as the system automatically remediates the problem.
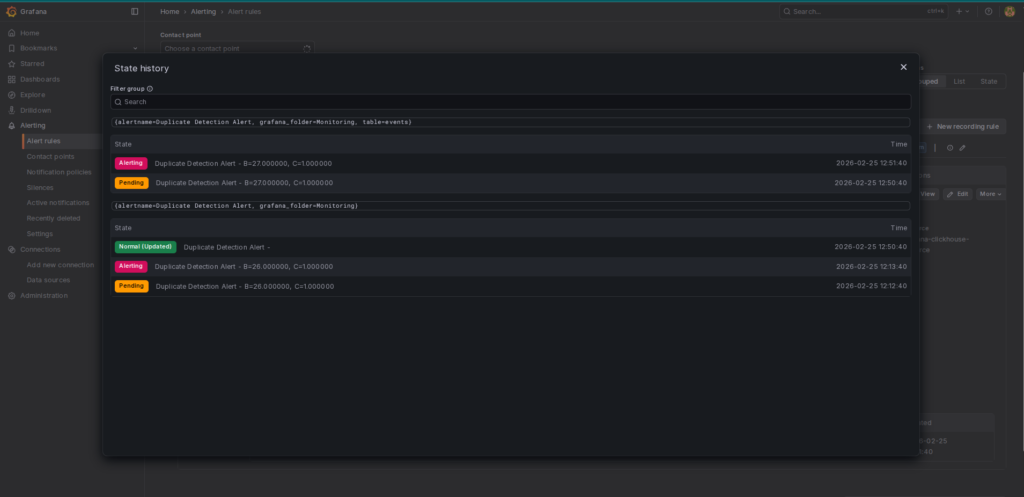
Alert State History
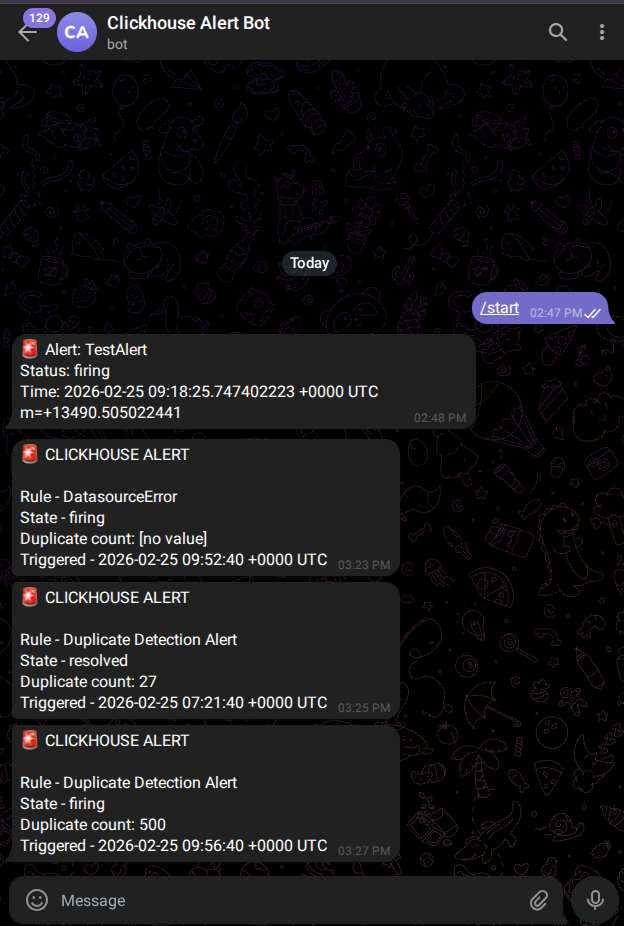
Telegram Alert message received
6. Implementation Challenges & Lessons Learned
Building the automated ClickHouse monitoring pipeline revealed several practical challenges:
- Asynchronous Deletions: ClickHouse deletions are asynchronous. Running table optimization after deletion is essential to ensure immediate consistency.
- Accurate Duplicate Metrics: Always capture anomaly metrics before remediation to ensure the logs reflect the actual issues found.
- Grafana Alert Configuration: Alert templates must match query outputs exactly to ensure successful notifications.
- Docker Networking: Validate container networking and dependencies early to ensure seamless service communication.
7. Real-World Use Cases
This architecture can be applied across multiple production scenarios:
- Data warehouse integrity monitoring
- Streaming pipeline validation
- Log ingestion systems
- Financial transaction platforms
- Production data engineering pipelines
Any environment that depends on reliable analytical data can benefit from automated validation and remediation.
Conclusion
This implementation demonstrates how open-source technologies can be strategically integrated to build a reliable and automated data monitoring framework. By combining ClickHouse for high-performance storage, Airflow for orchestration, Grafana for visualization, and Telegram for alerting, the system delivers a complete and structured monitoring lifecycle. The architecture not only detects anomalies but also performs automated remediation, logs operational metrics, and provides real-time visibility. As a result, it reduces manual intervention while strengthening data reliability and system stability. Overall, this approach reflects core data engineering principles centered on automation, observability, and operational resilience in production environments.
References
- ClickHouse Documentation
https://clickhouse.com/docs - ClickHouse MergeTree Engine Documentation
https://clickhouse.com/docs/en/engines/table-engines/mergetree-family/mergetree - Apache Airflow Documentation
https://airflow.apache.org/docs/ - Grafana Documentation
https://grafana.com/docs/ - Grafana Alerting Documentation
https://grafana.com/docs/grafana/latest/alerting/ - Telegram Bot API Documentation
https://core.telegram.org/bots/api