Data is only valuable when you can understand it. While ClickHouse® excels at storing and processing massive amounts of analytical data, Grafana transforms that data into interactive dashboards and visualizations.
In this blog, we’ll walk through everything, you needed to connect ClickHouse to Grafana, from installing the plugin to building your first dashboard.
What is Grafana?
Grafana is an open-source visualization and observability platform used by teams across the world to make sense of their data. It supports a wide range of data sources, from databases and cloud services to monitoring tools, and brings everything together in one place through interactive dashboards, alerts, and powerful query capabilities.
Key features of Grafana:
- Supports 100+ data source plugins.
- Real-time dashboards with auto-refresh.
- Alerting and notifications.
- Role-based access control.
- Rich visualization options including graphs, tables, heatmaps, gauges, and more.
Grafana is widely used for infrastructure monitoring, application performance tracking, business analytics, and IoT data visualization.
Why Use Grafana with ClickHouse®?
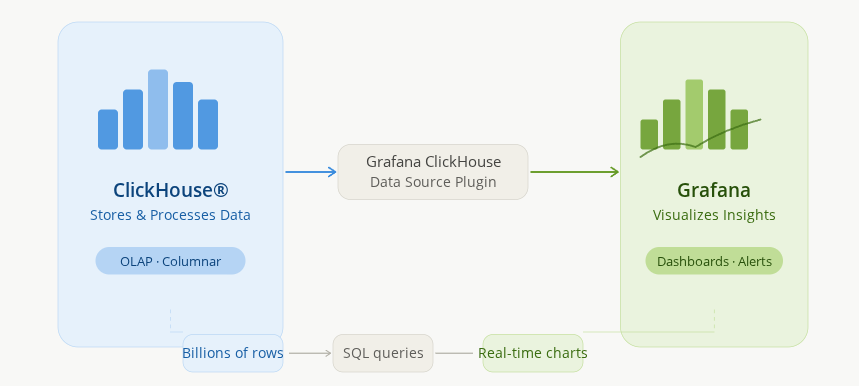
ClickHouse and Grafana complement each other extremely well:
- ClickHouse ingests and stores billions of events, logs, and metrics at high speed.
- Grafana queries that data and presents it as real-time visual dashboards.
Together, they form a powerful analytics stack.
Common UseCases:
- Real-time application monitoring.
- Business KPI dashboards.
- Log and event analytics.
- Time-series visualization at scale.
- Infrastructure and DevOps observability.
Prerequisites
Before getting started, make sure you have the following:
- ClickHouse® installed and running.
- Grafana installed and accessible.
- Access to a ClickHouse® database.
- Sample data (we’ll use the UK Property Price Paid dataset).
Step 1: Verify ClickHouse® is Running
Before configuring Grafana, confirm that ClickHouse® is running correctly.
1. Check the server status:
sudo systemctl status clickhouse-server2. Verify the HTTP endpoint:
curl http://localhost:8123/ping
Expected Output:
 OK.
3. Connect using the ClickHouse® client:
clickhouse-clientRun:
SELECT version();Step 2: Install Grafana
If you don’t have Grafana installed yet, here’s how to get it running quickly.
On Ubuntu-based systems:
1. Installing Prerequisites
sudo apt install -y wget gpg2. Create Keyring Directory
sudo mkdir -p /etc/apt/keyrings3. Download Grafana’s GPG Key
wget -q -O - https://apt.grafana.com/gpg.key | sudo gpg --dearmor -o /etc/apt/keyrings/grafana.gpg4. Adding Grafana Repository
echo "deb [signed-by=/etc/apt/keyrings/grafana.gpg] https://apt.grafana.com stable main" | sudo tee /etc/apt/sources.list.d/grafana.list5. Update Package List
sudo apt update6. Install Grafana
sudo apt install grafana -y7. Checking Version
grafana-server -v
---Expected: Version 13.X.X
8. Start the Grafana service
sudo systemctl enable grafana-server
sudo systemctl start grafana-server
9. Verify:
sudo systemctl status grafana-server10. Access Grafana
Open your browser and navigate to:
http://localhost:3000Default credentials:
Username: admin
Password: admin
You will be prompted to change the password on first login.
Step 3: Install ClickHouse® Data Source Plugin
After logging into Grafana:
- Go to Connections → Add New Connection.
- Search for ClickHouse.
- Select:
grafana-clickhouse-datasource4. Install the plugin.
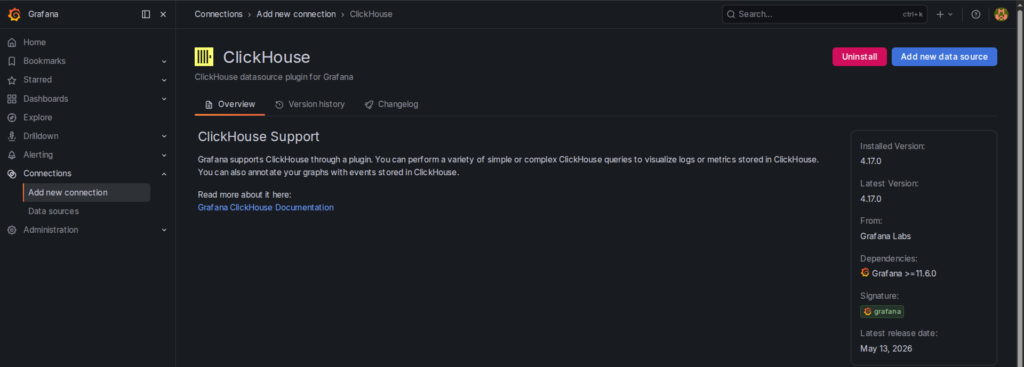
ClickHouse Data Source Plugin installed in Grafana
Step 4: Add ClickHouse® as a Data Source
Once the plugin is installed, add ClickHouse as a data source in Grafana.
- Click Add new data source.
- Fill in the connection details:
| Setting | Value |
|---|---|
| Server Address | Your ClickHouse host (e.g.localhost) |
| Port | 9000 (native) or 8123 (HTTP) |
| Protocol | Native or HTTP |
| Username | Your ClickHouse username (Default) |
| Password | (leave empty if not configured) |
| Database | Your target database name |
3. Click Save & Test
If the connection is successful, you will see a green “Data source is working” message. If it fails, double-check your host, port, and credentials, and make sure ClickHouse is accessible from the Grafana server.
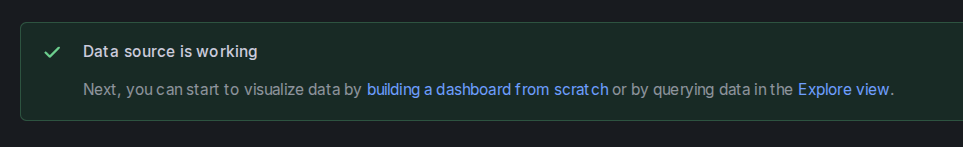
ClickHouse data source connection successful in Grafana
Step 5: Build Your First Dashboard
Now the fun part, creating a dashboard.
For this demonstration, we use the UK Property Price Paid dataset containing over 31 million property transactions.
Create a new dashboard:
Dashboards
    ↓
New Dashboard
Add a new panel and configure the Visualization.
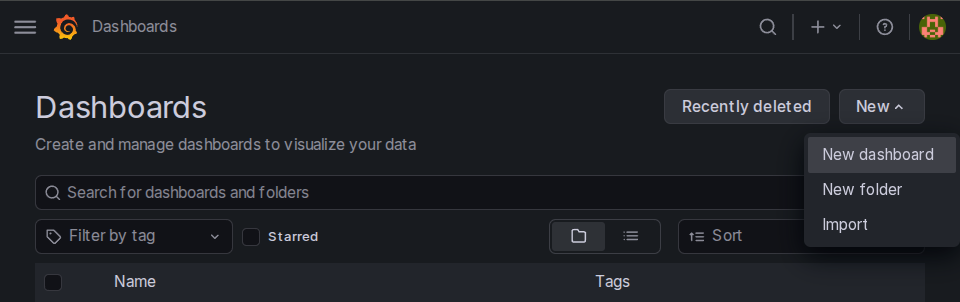
Creating a new dashboard in Grafana
Dashboard 1: Total Property Transactions
Query:
SELECT count() AS total_transactions
FROM uk.uk_price_paid;
Visualization:
StatResult:
31,270,275This provides an instant overview of dataset size.
Dashboard 2: Average House Price Trend
Query:
SELECT
    toYear(date) AS year,
    round(avg(price), 0) AS avg_price
FROM uk.uk_price_paid
GROUP BY year
ORDER BY year;
Visualization:
Time SeriesThis chart reveals long-term housing market trends and price growth over time.
Dashboard 3: Top 10 Towns by Number of Sales
Query:
SELECT
    town,
    count() AS sales
FROM uk.uk_price_paid
GROUP BY town
ORDER BY sales DESC
LIMIT 10;
Visualization:
Bar ChartThis identifies the most active property markets in the dataset.
Dashboard 4: Top 10 Counties by Average Price
Query:
SELECT
    county,
    round(avg(price), 0) AS avg_price
FROM uk.uk_price_paid
GROUP BY county
ORDER BY avg_price DESC
LIMIT 10;
Visualization:
Bar GaugeThis helps compare property values across counties.
Dashboard 5: Property Type Distribution
Query:
SELECT
    type,
    count() AS total
FROM uk.uk_price_paid
GROUP BY type
ORDER BY total DESC;
Visualization:
Pie ChartThis shows how property transactions are distributed among: Detached, Semi-detached, Terraced, Flats and Others.
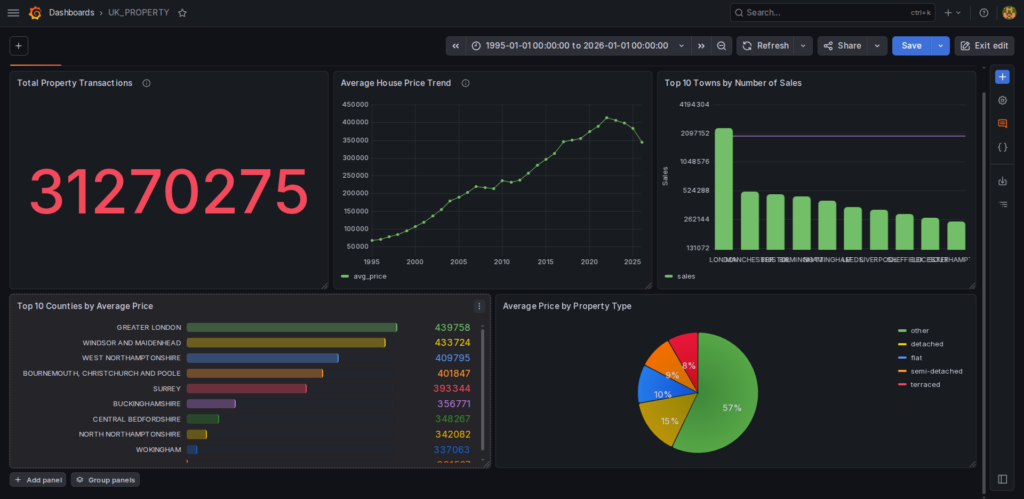
UK Property Price Paid dashboard in Grafana
Understanding Dashboard Panels
A Grafana dashboard is made up of multiple panels. Each panel is an independent visualization block, it has its own data source, its own query, and its own chart type.
Think of a dashboard as a page, and panels as the individual widgets placed on that page. You can mix and match panel types freely, a time series graph next to a stat card next to a data table, all on the same dashboard, all querying ClickHouse® independently.
For Example:
Dashboard
│
├── Total Property Transactions (Stat Panel)
├── Average House Price Trend (Time Series Panel)
├── Top 10 Towns by Sales (Bar Chart Panel)
├── Top 10 Counties by Average Price (Bar Gauge)
└── Property Type Distribution (Pie Chart Panel)
Each panel is responsible for answering a specific business question using data from a connected source.
Behind the scenes, every panel consists of:
- A data source (ClickHouse®).
- A query that retrieves the required data.
- A visualization that presents the results.
When a dashboard is loaded, Grafana executes the query for each panel, retrieves the results from ClickHouse®, and renders them as interactive visualizations.
Step 6: Setting Up Alerts (Optional)
Grafana can alert you when a metric crosses a threshold, which is useful for monitoring dashboards built on ClickHouse data.
To set up an alert:
- Open a panel and click Edit.
- Go to the Alert tab.
- Click Create alert rule.
- Define your condition (e.g., event count drops below 100).
- Set the notification channel (email, Slack, PagerDuty, etc.).
- Save the alert rule.
Why ClickHouse® Works So Well with Grafana
Several characteristics make ClickHouse® an ideal backend for Grafana dashboards:
- Column-Oriented Storage – ClickHouse® reads only the required columns, reducing I/O significantly.
- Fast Aggregations – Queries involving: COUNT(), SUM(), AVG(), GROUP BY are executed extremely faster.
- High Compression – Columnar storage enables efficient compression, reducing storage costs.
- Horizontal Scalability – ClickHouse® can scale across clusters while maintaining fast analytical performance.
Final Thoughts
Connecting ClickHouse® to Grafana combines the speed of a modern analytical database with the flexibility of an industry-leading visualization platform.
In this blog, we:
- Installed Grafana.
- Configured the ClickHouse® data source.
- Connected using HTTP.
- Queried real-world data.
- Built multiple dashboard visualizations.
With only a few steps, you can transform millions of rows of raw data into actionable insights and interactive dashboards.
Whether you’re building a business KPI dashboard, monitoring application logs, or tracking infrastructure metrics, ClickHouse and Grafana together give you the speed and clarity to act on your data in real time.
Exploring ClickHouse® for Your Analytics?
At Quantrail Data, we help teams run ClickHouse® reliably for real-time analytics – from Kubernetes deployments and migrations to performance tuning in production.
We see these challenges firsthand while supporting demanding analytics workloads. In one recent engagement, a customer achieved near bare-metal performance with ClickHouse® in production – a story we’ve shared here:
Success Story: Quantrail Bare-Metal ClickHouse® Deployment
If you’re evaluating ClickHouse® or trying to get more out of an existing setup, we’re happy to share practical lessons from real-world deployments.
Contact
Quantrail Data