When production issues occur, time is everything.
Imagine receiving an alert that query performance degraded at 2:47 AM. By the time a DBA or SRE investigates at 9:00 AM, the system appears healthy again. CPU usage is normal, queries are running smoothly, and no obvious errors are visible.
The problem isn’t that the issue didn’t happen.
The problem is that the evidence is scattered across multiple ClickHouse® system tables, making it difficult to reconstruct exactly what occurred at a specific point in time.
For organizations running ClickHouse® in production, this lack of centralized historical visibility can significantly increase troubleshooting time and operational complexity.
The Challenge of Point-in-Time Investigation
Modern database environments generate enormous amounts of operational data.
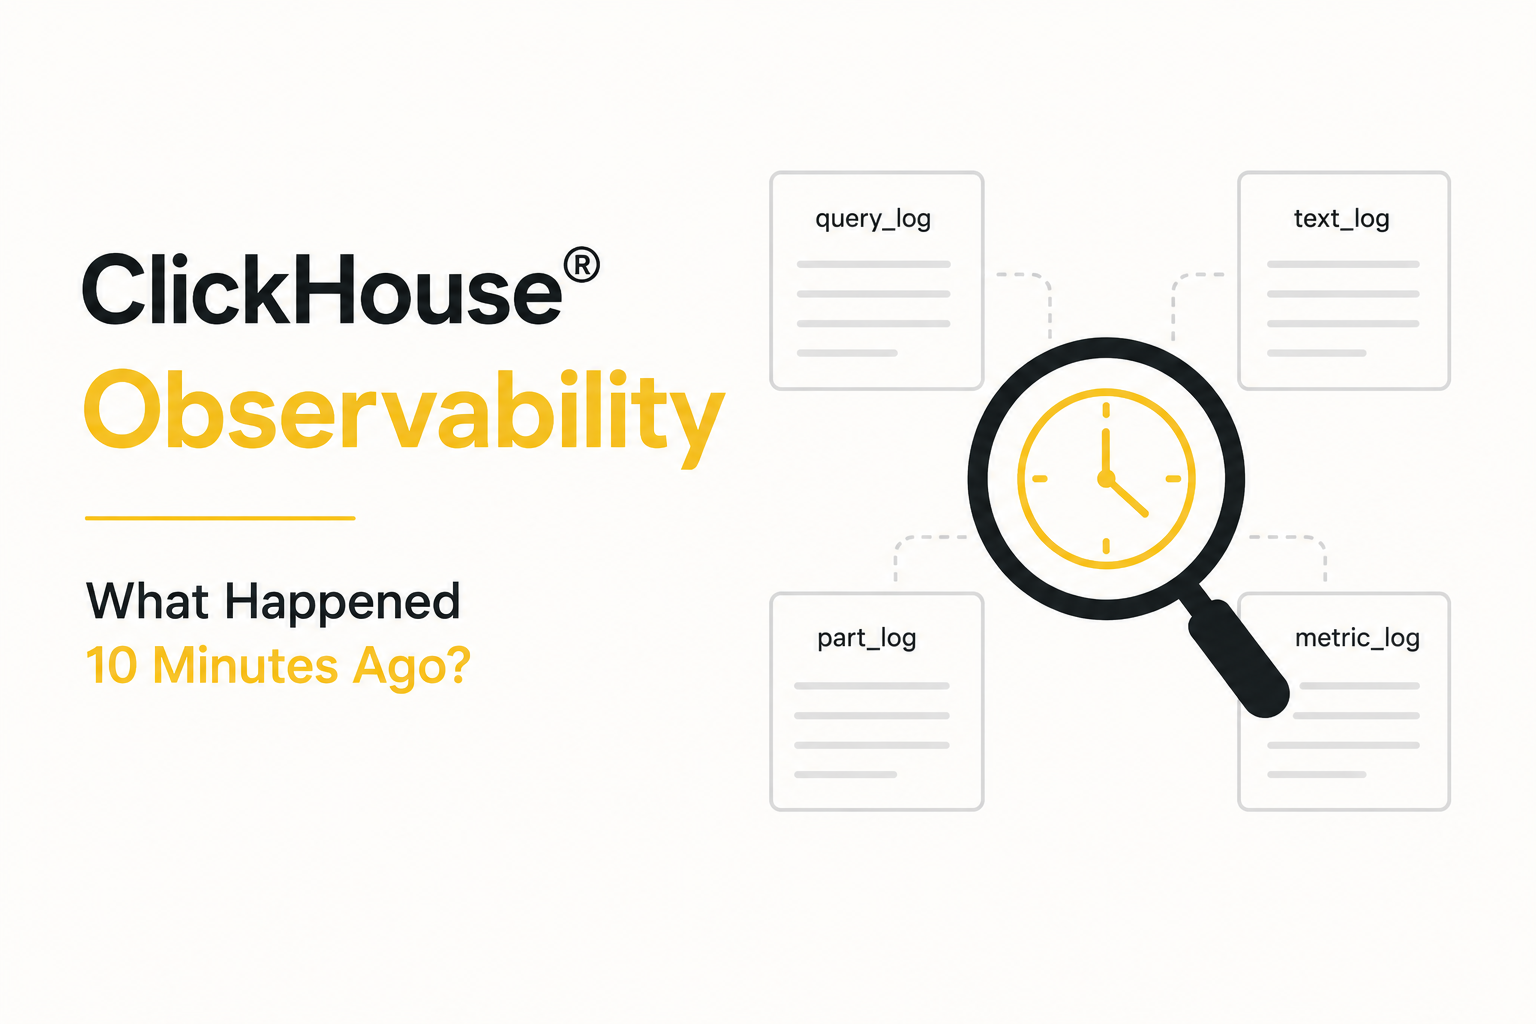
ClickHouse® records valuable information across multiple system tables, including:
system.query_logsystem.text_logsystem.part_logsystem.metric_logsystem.trace_logsystem.asynchronous_metric_log
Each table captures a different aspect of database activity.
Individually, these logs are extremely useful. Collectively, however, they create a challenge when administrators need to answer a simple question:
“What exactly happened at 2:47 AM?”
Finding the answer often requires querying several system tables independently and manually correlating timestamps.
The Investigation Process Is Manual
When a performance issue occurs, administrators typically need to perform multiple steps:
Query Analysis
First, they inspect system.query_log to identify slow or resource-intensive queries.
Questions include:
- Which queries were running?
- Did any queries fail?
- Were there unusual spikes in execution time?
System Events
Next, they review system.text_log for warnings, errors, and internal ClickHouse events.
This helps determine whether configuration issues, resource constraints, or background operations contributed to the problem.
Merge Activity
Administrators may then investigate system.part_log to determine whether heavy merge operations were occurring.
Large merges can consume CPU, memory, and disk resources that impact query performance.
Resource Metrics
Finally, they examine system.metric_log to understand system behavior during the incident.
This includes:
- CPU utilization
- Memory consumption
- Disk I/O
- Network activity
- Background task activity
Only after reviewing all these sources can they begin building a timeline of events.
Correlating Events Becomes Difficult
The biggest challenge is not finding data.
The challenge is connecting the data.
For example:
At 2:47 AM:
- A large analytical query started
- A background merge operation was running
- Memory usage increased
- Disk activity spiked
- Query latency increased
Each of these events may be recorded in different system tables.
Administrators must manually align timestamps and determine whether the events are related or simply occurred at the same time.
This process becomes increasingly difficult in busy production environments where thousands of events occur every minute.
Historical Troubleshooting Takes Longer
Without a centralized timeline, troubleshooting often becomes a time-consuming exercise.
Teams may spend hours:
- Writing SQL queries
- Filtering log data
- Matching timestamps
- Comparing metrics
- Building manual incident timelines
This slows down root cause analysis and extends the time required to resolve operational issues.
For organizations operating business-critical analytics platforms, delayed investigations can impact service reliability and operational efficiency.
The Need for Unified Observability
Most modern monitoring platforms provide a single timeline view where logs, metrics, events, and alerts can be correlated automatically.
This allows engineers to quickly answer questions such as:
- What changed before performance degraded?
- Which queries were active during the incident?
- Were background merges running?
- Did resource utilization spike?
- Were any warnings or errors generated?
With a unified view, troubleshooting shifts from data collection to actual problem solving.
Why This Matters at Scale
As ClickHouse® deployments grow, so does operational complexity.
Organizations often operate:
- Multiple clusters
- Multiple environments
- High-ingestion workloads
- Large analytical queries
- Continuous background merges
The volume of logs and metrics increases dramatically.
Without centralized observability, understanding historical incidents becomes progressively more difficult and time-consuming.
What might take five minutes in a small environment can require hours in a large production deployment.
The Real Risk
The greatest risk isn’t missing data.
ClickHouse® records a tremendous amount of operational information.
The risk is that critical information is fragmented across multiple locations, making rapid incident investigation difficult when teams need answers quickly.
During an outage or performance degradation event, every minute spent gathering evidence is a minute not spent solving the problem.
Conclusion
ClickHouse® provides rich operational data through its system tables, but reconstructing events from a specific point in time often requires querying multiple logs and manually correlating timestamps.
As production environments scale, this fragmented approach can slow troubleshooting, increase operational overhead, and extend incident resolution times.
The challenge is not collecting data it’s transforming scattered information into a clear, unified timeline that helps teams understand exactly what happened when it matters most.